|
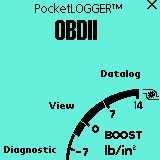
Tap "Datalog" to collect data, store data, and retrieve saved logs.
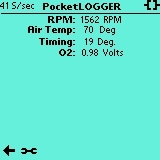
Tap "View" to view raw sensor values.
Tap "Diagnostic" to check and clear stored DTCs.
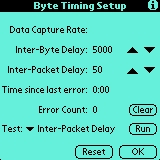
Whenever you connect to a different car, you must run this test.
Start by pressing the Reset button. This resets the two delay values to a default value. All ISO 9141-2 OBDII compliant cars should have no problems communicating when these values are used. At this point PocketLOGGER should have connected to the car and you should be seeing the Samples Per Second value being updated. If it has not connected within 10 seconds, cycle the car's ignition. Improper settings on this screen may stop the ECU from responding to the OBDII port, requiring the ignition to be cycled.
Make sure the Test pull-down menu is on Inter-Packet Delay and tap the Run button. You will notice that the Inter-Packet Delay value will slowly decrement. As this value decreases, you should see the samples per second start to increase.
There will come a point where PocketLOGGER will send data too fast for the ECU to understand and this will cause errors. When this happens you will see the Error Count value start to increase. PocketLOGGER will automatically detect communication errors and will start incrementing the Inter-Packet Delay until a reliable connection is made.
The longer you let the test run, the more reliable the connection is. The tradeoff is that the connection may be a little slower. We recommend running the test until the "Time Since Last Error" value reaches at least one minute or more.
Once everything has stabilized, you can tap the Stop button. Tap the Test Drop-down menu and switch to the Inter-Byte Delay test. Tap Run and the above procedure will repeat for the Inter-Byte Delay value.
Again, press Stop once everything has stabilized. Tap the OK button to return to the main menu.
PocketLOGGER is now set up to extract data at the fastest reliable rate possible for that particular car. These values will be saved until you change them. Remember that every car is different so you must re-run this test when connected to a different car. Failure to do so may cause PocketLOGGER to be unable to connect to the new car.
You can use the Up and Down arrows next to each delay value to manually change them as long as a test is not running. They are not needed for normal operation. While a test is running, none of the buttons respond.
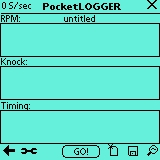
2: Check the connection status in the upper right hand corner.
 = connection not established
 = connection established
3: Tap the "GO!" button to start the datalog.
4: Tap the "STOP" button (same as the GO button).
5: Tap the  icon to save the log or tap the
  icon to clear the unsaved log and start over.
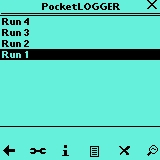
6: Tap the  icon to see a list of previously saved logs
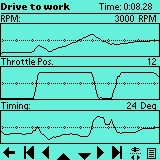
Viewing the Log
When saving a log, you have a choice of viewing the log or returning to the datalog screen for more logging. The "View Log" screen is where you can view your saved logs in detail. The buttons on the bottom of allow you to navigate the log.
  |
- Jump to the beginning or end of the log |
  |
- Scroll the log to the right (back) or left (forward) |
 |
- Change the currently viewed parameters (only if there's more than three) |
 |
- Go back to the previous screen |
 |
- View the note attached to the log |
 |
- Toggle slider |
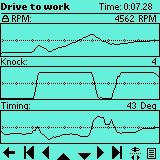
Use the hard Page Up/Page Down buttons to zoom in and out.
Slider Control
Use the slider to jump to any spot in the log.
As you slide the slider, the log time will be updated to reflect the position in the log, but the screen will not be updated until the slider is released.
 icon. This will bring you to a list of saved logs.
Tap a log in the list to highlight it and tap:
|
- to view the log |
|
- to view or edit the note attached to the log |
 |
- to delete the log |
|
- to go back to the datalog screen |
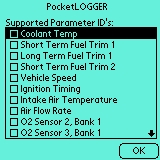
Tap the
 icon to set the parameters you want to view (up to 12)
Tap the
to return to the main screen
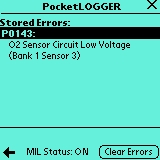
The diagnostic section allows reading and clearing of DTCs (Diagnostic Trouble Codes).
Stored Errors
Any errors stored in the ECU will be displayed in the list.
Tap the "Clear Errors" button to clear the error memory.
©2003 digital tuning, inc.